Delta Volume EMA Strategy
================================================================================
DELTA VOLUME EMA STRATEGY - STRATEGY GUIDE 📊
================================================================================
💡 COLLABORATION & SUPPORT
---------------------------
If you want to collaborate, have an idea for a strategy, or need help writing
or customizing code, send an email to burdytrader@gmail.com or send me a
message. Suggestions, ideas, and comments are always welcome! 🤝
================================================================================
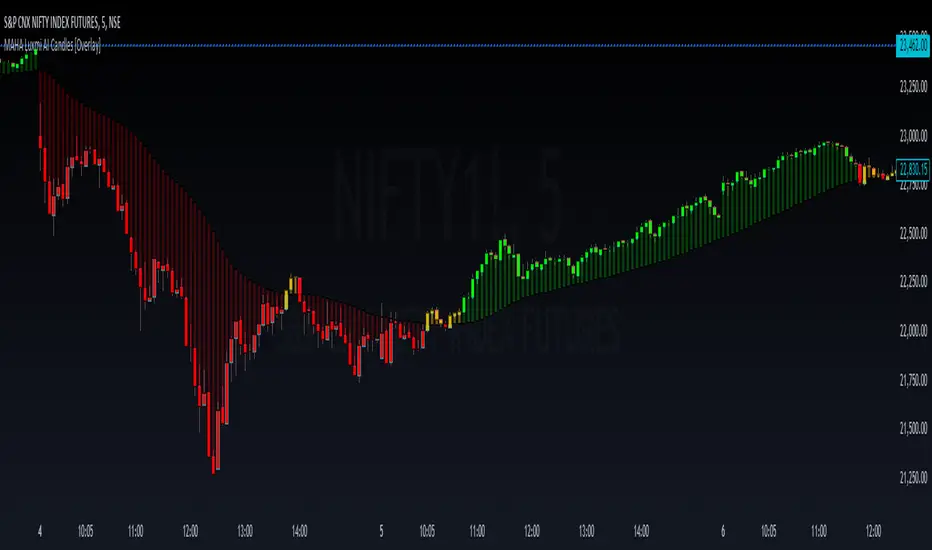
⚠️ IMPORTANT: INSTRUMENT SELECTION 📈
-------------------------------------
This strategy performs BEST with instruments that have a centralized data flow,
such as Futures contracts. Centralized markets provide more accurate and
reliable volume data, which is essential for Volume Delta analysis to work
effectively.
Why Futures? 🎯
- Centralized exchange = Accurate volume data
- All trades flow through a single exchange
- Volume reflects true buying/selling pressure
- Better correlation between volume and price movements
While the strategy can work with other instruments (stocks, forex, etc.),
volume data quality may vary, which can affect the reliability of Volume Delta
signals. For optimal performance, use Futures contracts or other instruments
with centralized, high-quality volume data.
================================================================================
WHAT DOES THIS STRATEGY DO? 🎯
---------------------------
This strategy uses Volume Delta analysis combined with Exponential Moving
Averages (EMA) to identify high-probability trading opportunities. The Volume
Delta measures the difference between buying and selling pressure, helping to
identify when strong institutional or smart money movements occur. The strategy
automatically enters trades when volume delta reaches extreme levels, indicating
potential trend continuation or reversal points.
HOW IT WORKS? ⚙️
---------------
1. VOLUME DELTA CALCULATION 📈
The strategy calculates the Volume Delta using the following formula:
- Volume Ratio (v) = Current Volume / Previous Volume
- EMA of Close (mac) = EMA(Close, MA Length) × Volume Ratio
- EMA of Open (mao) = EMA(Open, MA Length) × Volume Ratio
- Volume Delta (vd) = mac - mao
The Volume Delta shows:
- Positive values (green) = Buying pressure (buyers are more active)
- Negative values (red) = Selling pressure (sellers are more active)
2. VOLUME DELTA MOVING AVERAGE 📊
The strategy calculates an EMA of the Volume Delta (vdma) to smooth out
fluctuations and identify the overall trend of buying/selling pressure:
- vdma = EMA(Volume Delta, EMA Length)
- When vdma is above zero = Overall buying pressure
- When vdma is below zero = Overall selling pressure
3. PERCENTILE-BASED ENTRY CONDITIONS 🎲
Instead of using fixed thresholds, the strategy uses percentile analysis to
identify extreme volume delta movements:
For LONG entries:
- Analyzes seller volumes (negative volume delta) over the lookback period
- Calculates the percentile threshold (default: 80th percentile)
- Enters LONG when volume delta becomes positive AND exceeds the threshold
- This indicates a strong shift from selling to buying pressure
For SHORT entries:
- Analyzes buyer volumes (positive volume delta) over the lookback period
- Calculates the percentile threshold (default: 80th percentile)
- Enters SHORT when volume delta becomes negative AND exceeds the threshold
- This indicates a strong shift from buying to selling pressure
4. POSITION SIZING 💰
The strategy offers two position sizing methods:
a) RISK VALUE (Fixed Risk in Dollars):
- Calculates position size based on a fixed dollar risk amount
- Formula: Position Size = Risk Amount / (Entry Price × Stop Loss %)
- Ensures consistent risk per trade regardless of price level
b) LOTS SIZE:
- Uses a fixed lot size for all trades
- Simple and straightforward approach
- Useful when you want consistent position sizes
5. TAKE PROFIT & STOP LOSS SETTINGS 🎯
The strategy offers flexible TP/SL configuration in three modes:
a) PERCENTAGE (%):
- TP/SL calculated as a percentage of entry price
- Example: 2% TP means entry price × 1.02 (for LONG) or × 0.98 (for SHORT)
- Adapts automatically to different price levels
b) CURRENCY:
- TP/SL set as a fixed currency amount
- Example: $100 TP means entry price + $100 (for LONG) or - $100 (for SHORT)
- Useful for instruments with consistent price movements
c) PIPS:
- TP/SL set as a fixed number of pips
- Automatically converts pips to price using the instrument's minimum tick
- Ideal for forex and other pip-based instruments
6. AUTOMATIC TRADE EXECUTION ⚡
When entry conditions are met:
- Opens a position (LONG or SHORT) at market price
- Automatically sets Take Profit and Stop Loss based on selected mode
- Sends an alert with all trade information
- Only one position at a time (waits for current position to close)
AVAILABLE PARAMETERS ⚙️
----------------------
1. MA LENGTH (Default: 10)
- Length of the Exponential Moving Average used for close and open prices
- Lower values = More sensitive to recent price action
- Higher values = More smoothed, less sensitive
2. EMA LENGTH (Default: 20)
- Length of the EMA applied to Volume Delta
- Controls the smoothing of the volume delta signal
- Lower values = Faster signals, more trades
- Higher values = Slower signals, fewer but potentially more reliable trades
3. POSITION SIZE MODE
- "Risk Value": Calculate position size based on fixed dollar risk
- "Lots Size": Use fixed lot size for all trades
4. FIXED RISK IN $ (Default: 50)
- Only used when Position Size Mode = "Risk Value"
- The dollar amount you're willing to risk per trade
- Strategy calculates position size automatically
5. LOT SIZE (Default: 0.01)
- Only used when Position Size Mode = "Lots Size"
- Fixed lot size for all trades
6. TAKE PROFIT MODE
- "%": Percentage of entry price
- "Currency": Fixed currency amount
- "Pips": Fixed number of pips
7. STOP LOSS MODE
- "%": Percentage of entry price
- "Currency": Fixed currency amount
- "Pips": Fixed number of pips
8. TAKE PROFIT / STOP LOSS VALUES
- Different input fields appear based on selected mode
- Configure TP and SL independently
9. VOLUME LOOKBACK PERIOD (Default: 20)
- Number of bars used to calculate percentile thresholds
- Lower values = More sensitive, adapts faster to recent conditions
- Higher values = More stable, uses longer-term statistics
10. PERCENTILE THRESHOLD (Default: 80%)
- The percentile level used to identify extreme volume delta movements
- 80% means: only enter when volume delta exceeds 80% of recent values
- Higher values = Fewer but potentially stronger signals
- Lower values = More frequent signals
VISUALIZATION 📊
---------------
The strategy displays on the chart:
1. VOLUME DELTA COLUMNS
- Green columns = Positive volume delta (buying pressure)
- Red columns = Negative volume delta (selling pressure)
- Height represents the magnitude of buying/selling pressure
2. VOLUME DELTA MA AREA
- Two overlapping area plots showing the smoothed volume delta
- Black area (base layer) for overall visualization
- Green area (when positive) = Overall buying pressure trend
- Red area (when negative) = Overall selling pressure trend
- Helps identify the dominant market sentiment
3. ZERO LINE
- Horizontal line at zero
- Helps visualize when buying/selling pressure crosses the neutral point
ALERTS 🔔
--------
When enabled, the strategy sends alerts when a trade is opened. The alert
message includes:
- Direction: "Buy" for LONG positions or "Sell" for SHORT positions
- Entry Price: The price at which the position was opened
- TP (Take Profit): The target profit price
- SL (Stop Loss): The stop loss price
Example alert message:
"Buy | Entry: 1.2050 | TP: 1.2250 | SL: 1.1950"
Alerts can be configured in TradingView to send notifications via email,
SMS, webhooks, or other platforms.
RECOMMENDED SETTINGS 🎯
-----------------------
To get started, you can use these settings:
STRATEGY PARAMETERS:
- MA Length: 10 (default)
- EMA Length: 20 (default)
- Volume Lookback Period: 20 (default)
- Percentile Threshold: 80% (default)
POSITION SIZING:
- Position Size Mode: "Risk Value" (for risk management)
- Fixed Risk in $: Adjust based on your account size (e.g., 1-2% of account)
- OR use "Lots Size" with 0.01 lots for small accounts
TAKE PROFIT & STOP LOSS:
- TP Mode: "%" (recommended for most instruments)
- SL Mode: "%" (recommended for most instruments)
- Take Profit (%): 2.0% (adjust based on your risk/reward preference)
- Stop Loss (%): 1.0% (adjust based on your risk tolerance)
For Forex:
- Consider using "Pips" mode for TP/SL
- Typical values: 20-50 pips TP, 10-30 pips SL
For Stocks/Indices:
- Use "%" mode for TP/SL
- Typical values: 2-5% TP, 1-2% SL
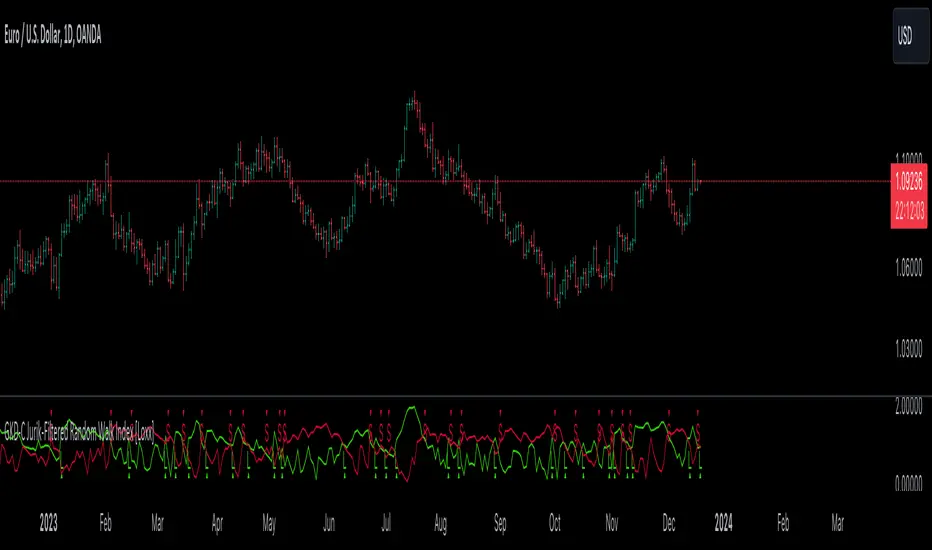
PRACTICAL EXAMPLE 📝
-------------------
Scenario: LONG Entry on EUR/USD
1. Market conditions:
- Price: 1.1000
- Volume Delta becomes strongly positive
- Volume Delta exceeds 80th percentile of recent seller volumes
2. Strategy calculates:
- Entry Price: 1.1000 (current close)
- Position Size Mode: "Risk Value"
- Fixed Risk: $50
- Stop Loss Mode: "%"
- Stop Loss: 1.0%
- Position Size = $50 / (1.1000 × 0.01) = 4.55 lots
3. Strategy opens position:
- Direction: LONG (Buy)
- Entry: 1.1000
- Take Profit: 1.1220 (2% above entry)
- Stop Loss: 1.0890 (1% below entry)
- Alert sent: "Buy | Entry: 1.1000 | TP: 1.1220 | SL: 1.0890"
4. Outcome scenarios:
- If price rises to 1.1220 → Take Profit hit (profit)
- If price falls to 1.0890 → Stop Loss hit (loss limited to $50)
IMPORTANT NOTE ⚠️
-----------------
This strategy is a technical analysis tool based on volume delta analysis.
Like all trading strategies, it does NOT guarantee profits. Trading involves
significant risks and you can lose money, including your entire investment.
Past performance does not guarantee future results.
Always:
- Use appropriate risk management
- Never risk more than you can afford to lose
- Test the strategy on historical data (backtesting) before using real money
- Start with small position sizes or paper trading
- Understand that no strategy works 100% of the time
- Consider market conditions, news events, and other factors
- Keep a trading journal to learn and improve
The author and contributors are NOT responsible for any losses incurred from
using this strategy. Trading decisions are your own responsibility. Profits
are NOT guaranteed, and losses are possible.
LICENSE 📄
---------
This code is open source and available for modification. You are free to use,
modify, and distribute this strategy. If you republish or share a modified
version, please kindly mention the original author.
================================================================================
Стратегия Pine Script®